
Bitcoin price forms two risky patterns as ETF outflows rise
As the Bitcoin price retreats below the $110,000 support level, two risky chart patterns have formed while exchange-traded fund (ETF) outflows rise.
Summary
- Bitcoin price has formed a head-and-shoulders pattern.
- BTC has also formed a rising wedge pattern on the weekly chart.
- Bitcoin ETF inflows have slowed for two consecutive weeks.
Bitcoin price retreats amid ETF weakness
At last check on Saturday, September 27, Bitcoin (BTC) was trading at approximately $109,600. That’s down 12% from its all-time high. It is also hovering at its lowest level since September 2.
BTC and other cryptocurrencies pulled back this week as demand from American investors eased. Data compiled by SoSoValue shows that ETF inflows have slowed in the past two weeks.
All Bitcoin ETFs experienced outflows of $902 million this week, after adding $886 million a week earlier. They said $2.34 billion the week of September 12.
One potential reason for the weakness is that some Federal Reserve officials warned about interest rate cuts. Officials like Austan Goolsbee, Beth Hammack, and Raphael Bostic cautioned that the Fed should be cautious when cutting rates.
These officials noted that inflation has remained above the 2% target for over four years. They also noted that the labor market was still strong, citing the low unemployment rate.
Also, the economy has been resilient, with a recent report showing that it expanded by 3.8% in the second quarter. The number of Americans filing for jobless claims has dropped significantly in the past few weeks.
Looking ahead, the next important catalyst for Bitcoin and other coins will be the non-farm payrolls data on Friday. These numbers will help to determine whether the Fed will cut interest rates in the October meeting.
BTC price has formed a head-and-shoulders pattern
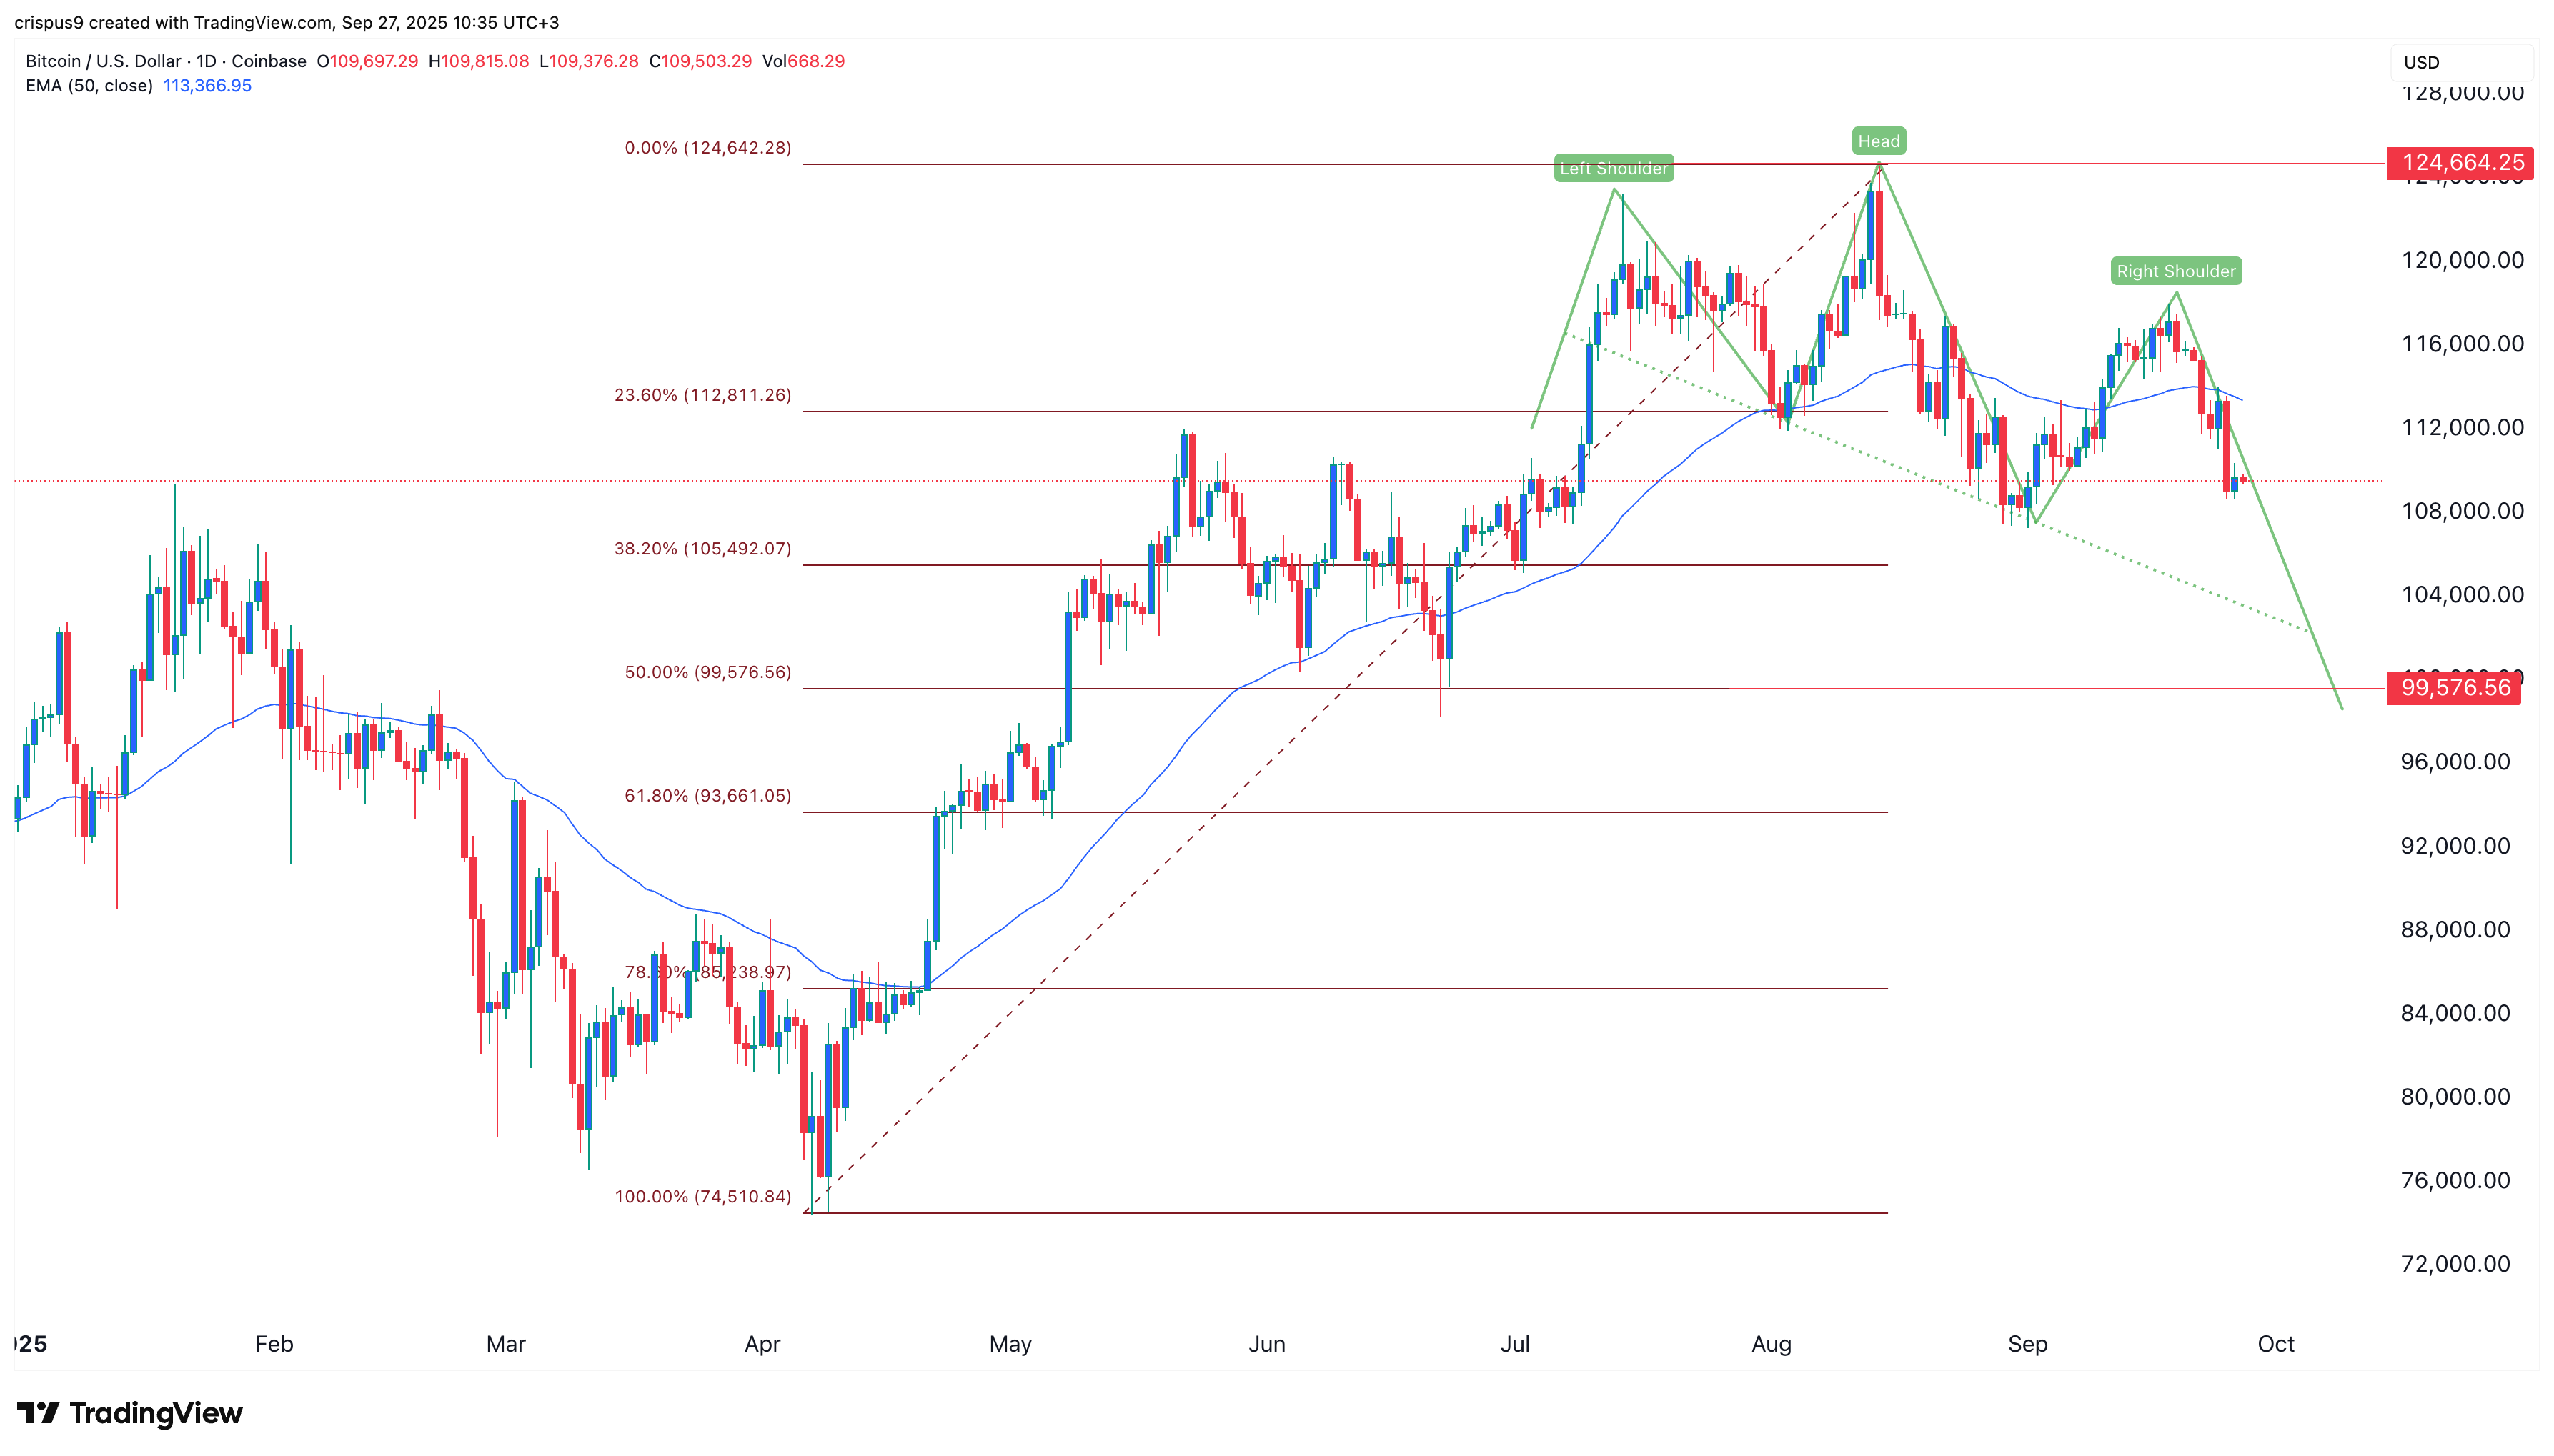
The daily timeframe chart shows that the Bitcoin price has pulled back in the past few weeks. A closer look reveals that it has slowly formed a head-and-shoulders pattern, which often signals further downside.
It has also moved below the 50-day Exponential Moving Average, while the Relative Strength Index has pointed downwards. These patterns suggest further downside potential to the 50% Fibonacci Retracement level at $100,000.
BTC formed a rising wedge and bearish divergence
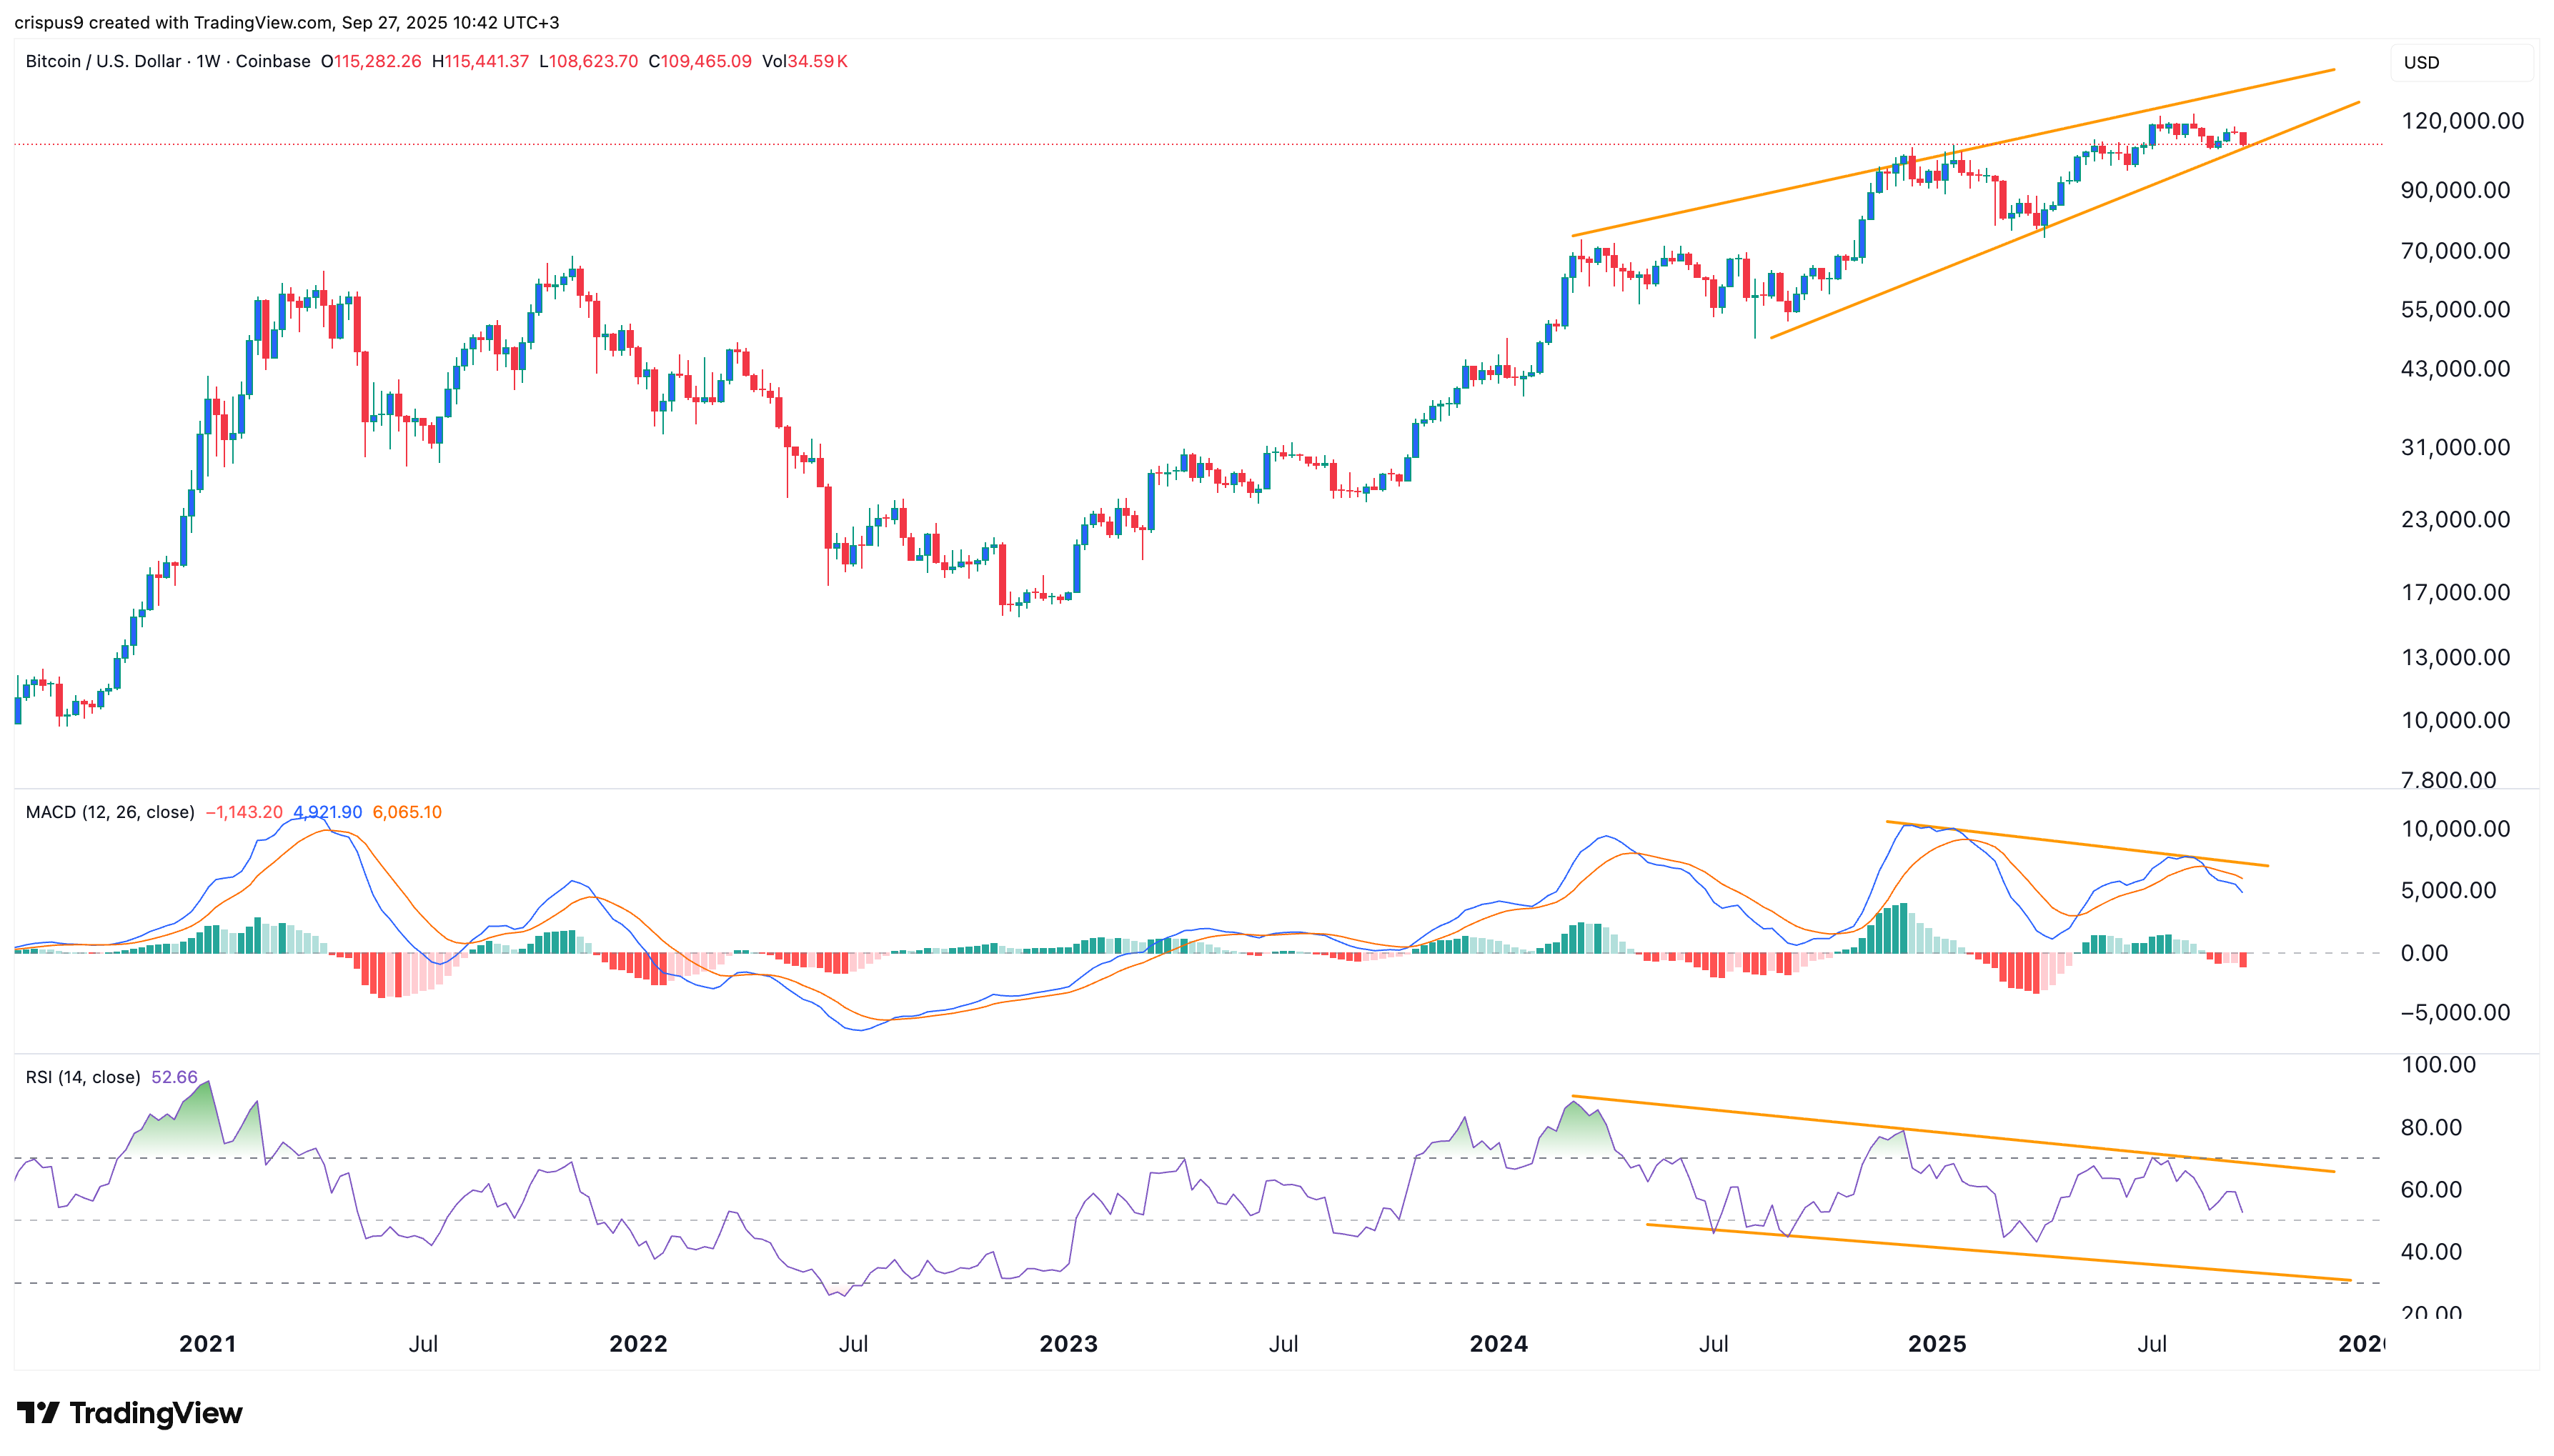
The weekly chart indicates that the Bitcoin price has formed a rising wedge chart pattern, characterized by two converging trendlines that are rising. These two lines are nearing their confluence, indicating a potential bearish breakout.
At the same time, oscillators like the Relative Strength Index and the MACD have formed a bearish divergence pattern as they have moved downwards, as it kept rising. These two patterns also indicate further downside in the coming weeks.
Share this content:


إرسال التعليق